Situation:
Chicago Public Schools face wide disparities in student outcomes, with performance influenced by attendance, safety, and school environment. Policymakers needed actionable insights to better allocate resources and improve instructional quality.
Task:
The goal was to analyze a comprehensive dataset of 566 schools (79 features) from Chicago Public Schools to identify the key drivers of instructional quality and uncover geographic disparities in school performance.
Action:
- Data Preparation: Cleaned and preprocessed the dataset, handling missing values and converting categorical data into numerical formats. Extracted geographic data for spatial mapping.
- Exploratory Data Analysis: Built correlation heatmaps and boxplots to explore relationships between attendance, environment, and performance metrics.
- Modeling:
- Applied linear regression models to evaluate predictors of instructional quality and attendance.
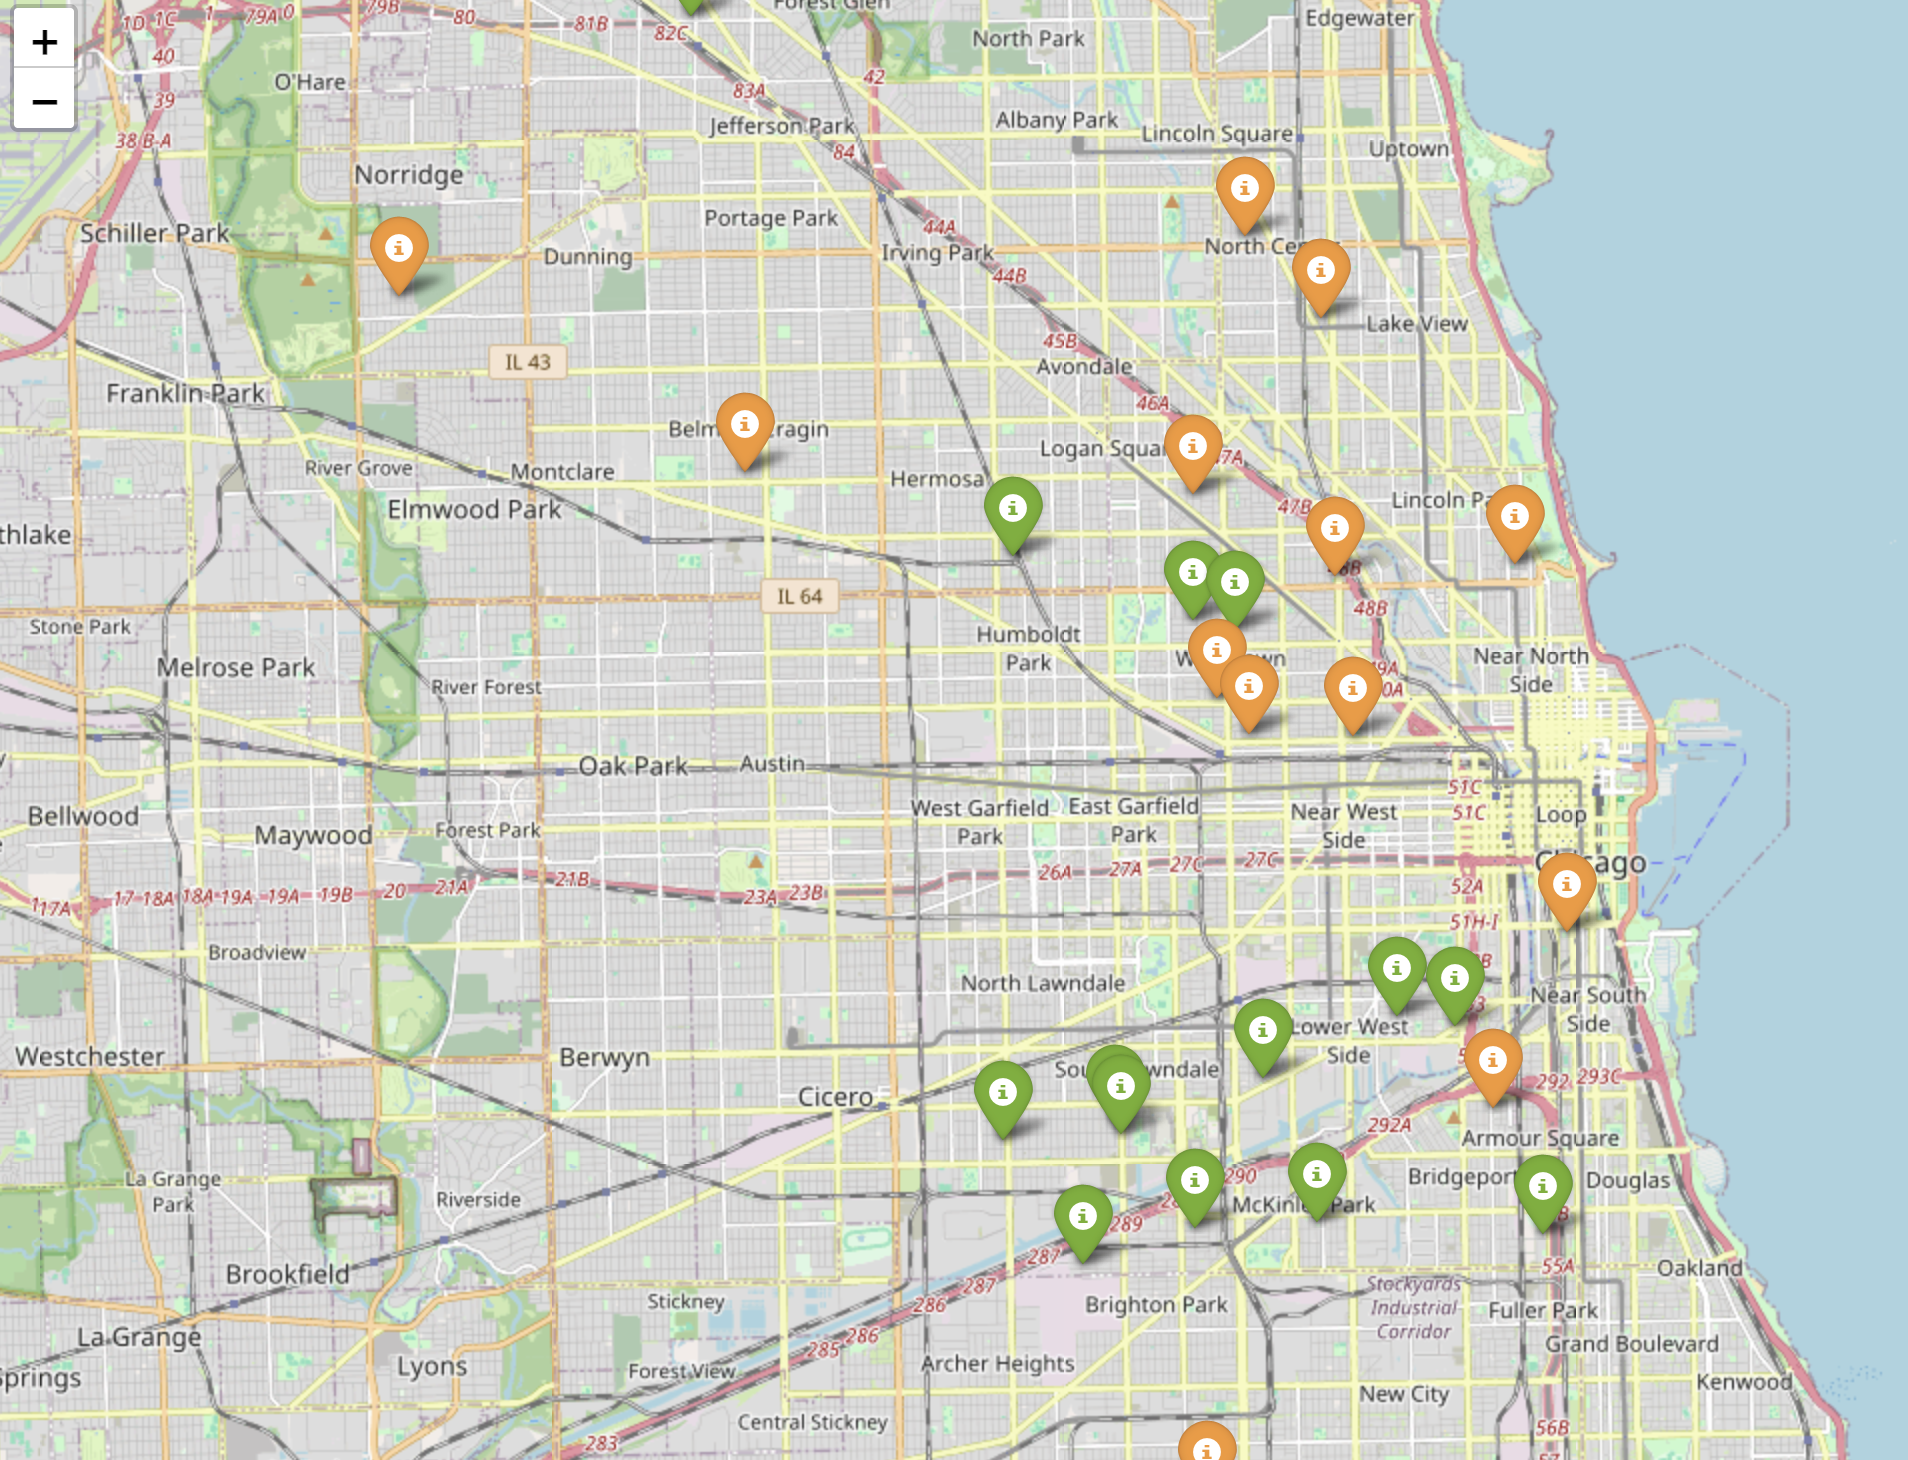
- Used clustering techniques (with Folium maps) to identify geographic patterns of “Healthy School Certified” institutions and schools with safety scores >70.
- Insights: Found that student attendance and environment score explain ~73.5% of the variance in instructional quality. Family involvement also influenced attendance, but explained only ~30% of the variation.
Result:
- Identified attendance and supportive environments as the strongest levers to improve instructional quality.
- Revealed geographic disparities, with clusters of safe, certified schools concentrated in certain neighborhoods, while underserved areas lacked resources.
- Produced policy recommendations emphasizing equitable resource allocation, parent engagement, and holistic community support to improve educational outcomes.
Download the report here:
